LogTag Analyzer System Requirements
This article gives the system requirements for the LogTag Analyzer software. For information about Downloading the LogTag software check that article.
To ensure that the Analyzer software will work on your computer following minimum specifications are required:
The recommended specifications are:
If you are unsure of your computer's specifications, please refer to your operating system's documentation or help function.
MAC
If you are working on an Intel-based Mac you can use LogTag Analyzer versions 2.0r17 and later, however you must use a virtual machine software such as VirtualBox, VMWare Fusion, Parallel Desktop or similar. You can find a summary of the steps in the document about “Installing LogTag® Analyzer on an Apple Mac" using VirtualBox, which you can download from here.
Unfortunately, there is no recommended solution for Apple M1 Macs.
LINUX
Unfortunately, we cannot recommend installing the LogTag Analyzer software on the Linux operating system. Some users have reported success with installation via WINE, but this is experimental and LogTag Recorders can only offer limited support. We will continue to monitor the suitability of WINE for LogTag® Analyzer and publish new information as necessary.
Alternatively, you can use a Windows-based virtual machine via VirtualBox.
CITRIX
You can use LogTag Analyzer in a Citrix environment, however there are certain restrictions. For more information, have a look at this document.
CHROME
Our software isn't compatible with the Chrome OS (Operating System). Chromebooks do not actually have a Windows OS, they only work with web applications, any actual applications have to be specifically written for Chrome OS in order to run on a Chromebook.
USB 3.0
At this stage all major computer manufacturers provide USB 3.0 ports mainly to support storage devices such as external hard drives with higher speed requirements. On some computers driver incompatibilities between some of the controlling hardware and the LogTag Interface Cradle drivers could exist, which is unfortunately outside LogTag Recorders control.
Although we have tested LogTag Interface Cradles on USB 3.0 ports of different computer manufacturers without issues we would still advise using USB 2.0 ports where available. There is no advantage of using LogTag Interface Cradles on a USB 3.0 port.
There are two types of LogTag Analyzer 3 releases, a major update that contains important changes that would affect a large number of users, and a minor update that affects on a niche set of users or is non critical.
We only inform users via the software notification system of Major releases (e.g, Version 3.1.7), not minor ones (e.g. Version 3.1.8) as most users don't want to upgrade. We try and stick to one major update per year if we can.
Note: We don't make this distinction on our website, as it could create confusion for some users. Please visit the https://www.logtag-recorders.com/en/support/ page for the latest LogTag Analyzer 3 version.
Our software can be downloaded via the support page on our website. You can find instructions here, how to get started.
LogTag Analyzer is free to use, however, some of the features connected top the software such as the ability to upload data to LogTag Online may require a subscription.
You need to agree to the license terms set out in the user guide, including the LogTag Recorders privacy policy.
System Requirements
LogTag Analyzer is designed to run on Windows computers. Check out the LogTag Analyzer System Requirements and supported operating systems.
Uninstalling LogTag Analyzer
Open “Control Panel" – “Add/Remove Programs", or “Control Panel" – “Programs and Features"; highlight “LogTag Analyzer" and select “remove".
If you are removing version 2.3 or higher, you also need to remove the USB drivers: highlight “USB Interface Cradle Drivers" and select “remove"
On some occasions this may not remove every single file from your computer. In that case please delete following files also:
Note:
Occasionally we receive reports of antivirus software blocking LogTag software updates. We advise customers who see this, to please disable their antivirus while installing the LogTag software.
If you aren’t able to open an exe file on your computer (due to security restrictions) you will also find an alternative download link for a zip file, which you need to unpack before you can run the installer.
The existing cradle drivers are compatible with the updated software.
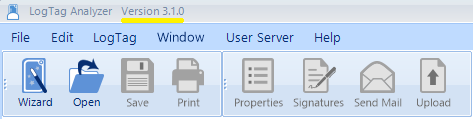
You are able to find the version number of LogTag Analyzer by opening LogTag Analyzer. At the top left corner of your window, your version number will be shown.
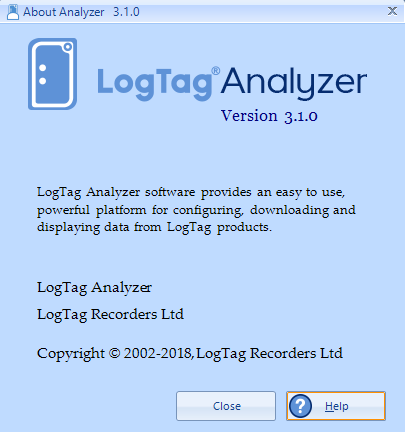
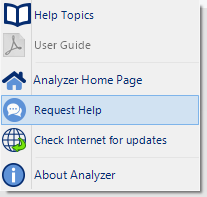
Otherwise you can also go to "Help" and click on "About Analyzer". The following screen (with software version number) will appear.
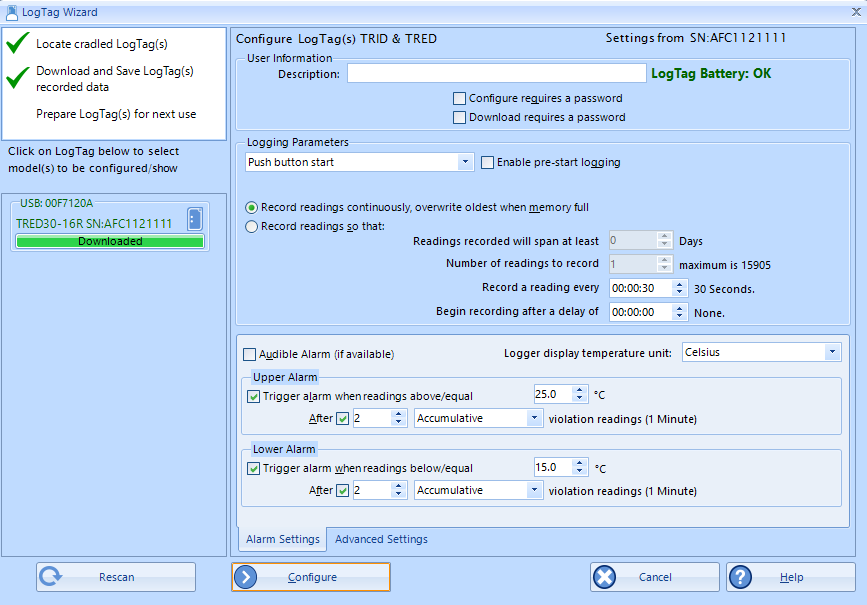
Connect the Logger to you computer via the interface cradle or USB. In order to start using your Logger, you need to configure it in LogTag Analyzer via the 'LogTag Wizard'. This can be accessed by pressing 'F2' on your keyboard or by clicking the 'Wizard' icon.
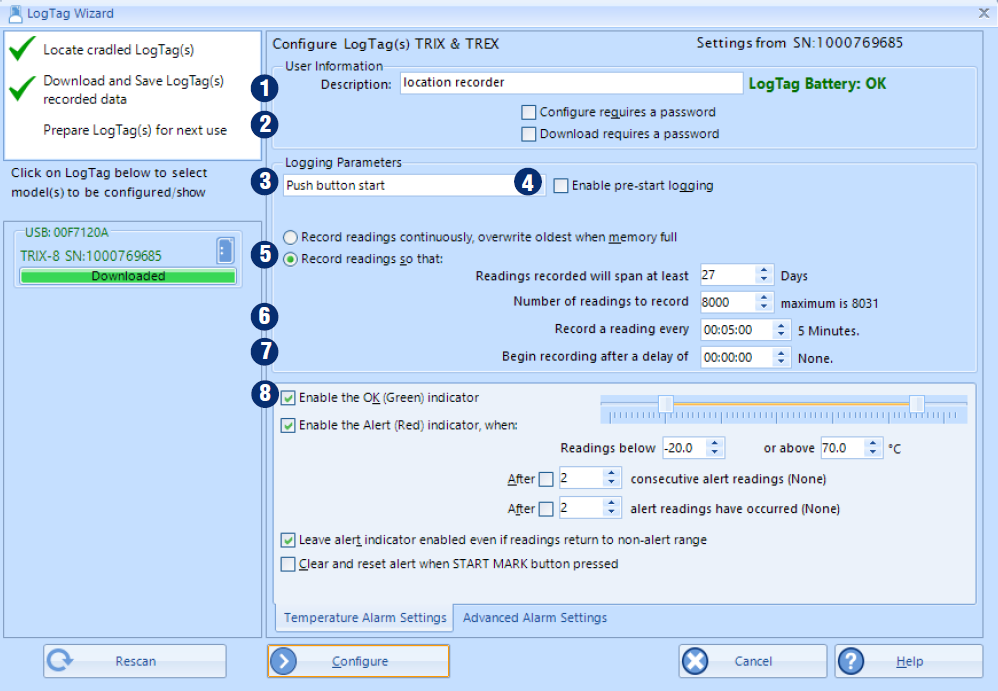
By clicking on 'Configure', your Logger will be configured and any previously stored data will be deleted from the Logger.
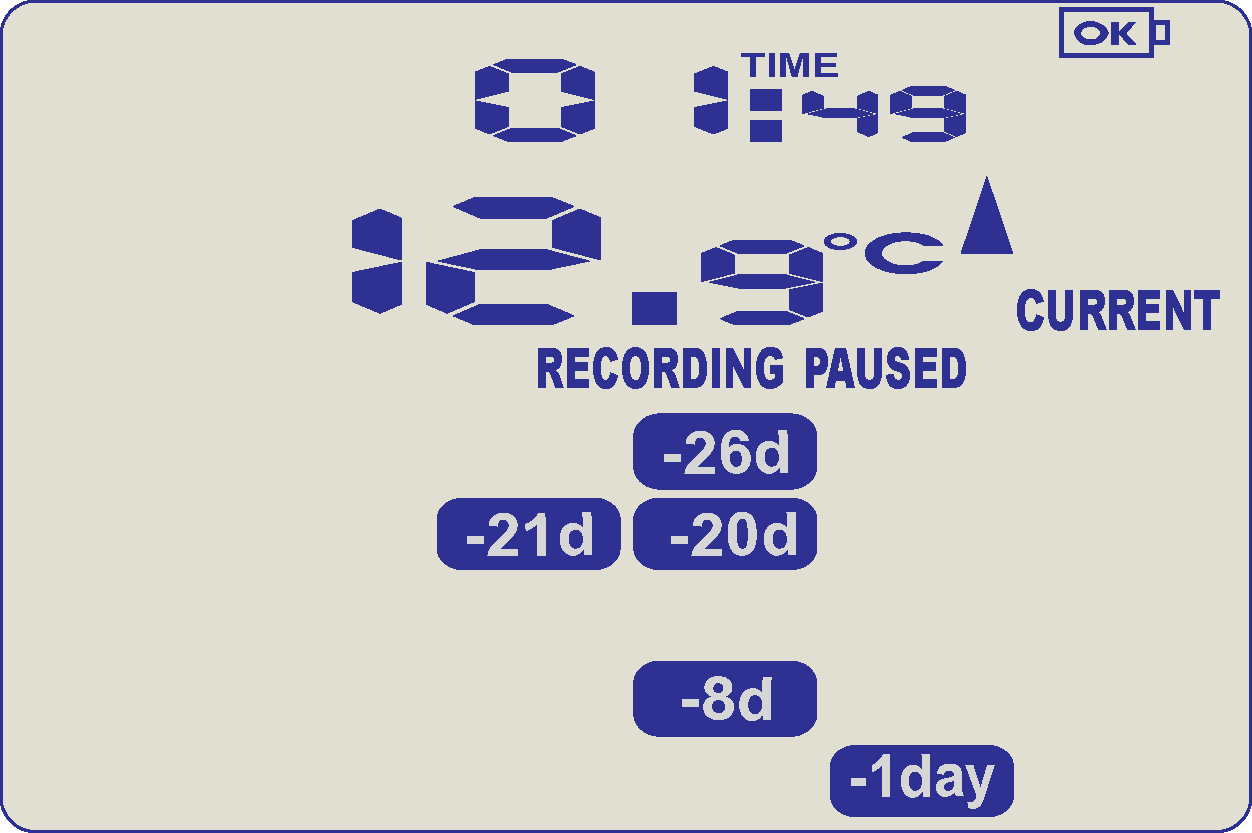
During configuration of loggers with a display you can set the option to ignore up to 15 readings for alarm- and statistics calculations after either button is pressed. The readings are still shown on the graph and in the data listing, but they are labelled as paused, and their value is ignored when determining alarm trigger conditions, minimum/maximum values and other statistical calculations. This function is useful when you wish to review readings during the logger's operation (or clear an alarm), but you do not wish to trigger an alarm due to your handling the product. It also allows the logger to acclimatize to the environmental conditions again, before further readings are processed.
After a button press the display shows the word PAUSED.
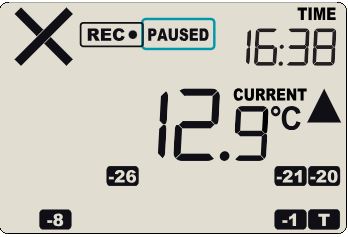
Paused readings are specially marked in the graph and data listings.
PAUSED will turn off as soon as the last ignored reading has been recorded. It will show longer, if your last button press was just after the logger took a temperature reading, but will be displayed for a shorter period if you pressed the button just before a reading is taken.
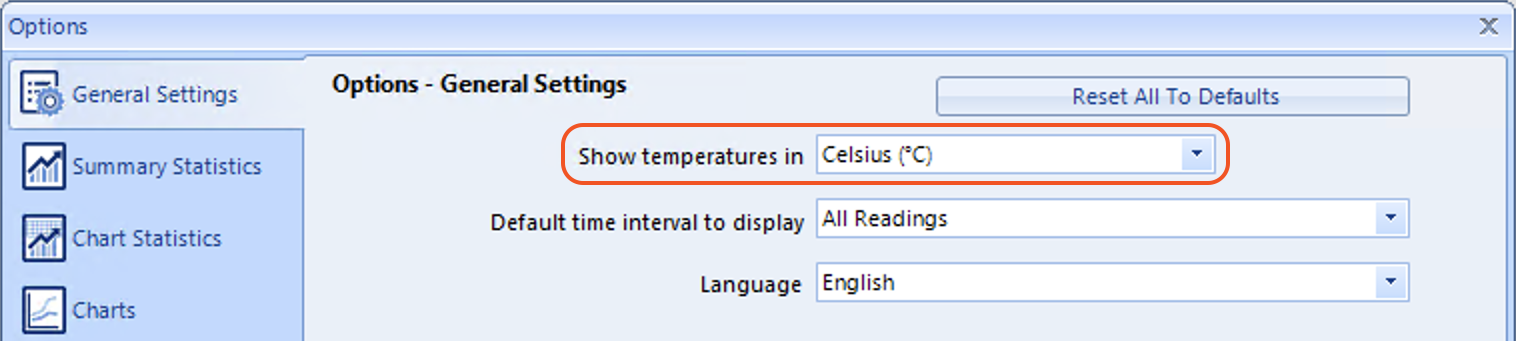
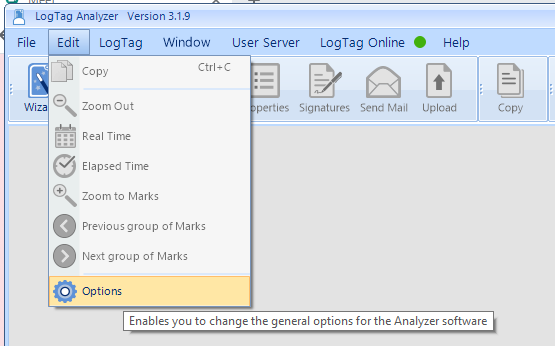
If you wish to change the temperature units used to display reports and charts in LogTag Analyzer, click Edit – Options, click on the General Settings tab and select the desired temperature unit in Show temperatures in. Select from Celsius, Fahrenheit or Kelvin.
Confirm the new settings by clicking OK at the bottom of the window.
Note: This does not change the temperature unit used on the display of a logger, or on the PDF generated directly by a USB logger.
See here how to change the temperature unit for those.
If you have changed the language (by accident). Take the following steps to change it to the original language:
Exit the LogTag Analyzer software and delete the file “User Profile.dat" from C:\Documents and Settings\#USER#\Application Data\LogTag. In VISTA and Windows 7, this file is located in C:\Users\#USER#\AppData\Roaming\LogTag.
You may need to change the display settings in Windows Explorer to be able to navigate to this file (Note: The Windows search feature will likely not find this file, however you can quickly navigate to the profile location by typing “%APPDATA% into the Windows Explorer Address Bar). Please refer to the Windows Operating System’s online help.
Once this file is deleted, the software menus will be displayed in the language set in the Regional Options of the operating system (if LogTag® Analyzer software supports this language, otherwise in English). Please note, that other settings you may have made like Communication port settings or default chart parameters will be lost.
From time to time LogTag Recorders will add new functionality to USB Loggers or enhance existing features. When a new version of LogTag Analyzer is released, we make these available to you – where possible – via a special upgrade function or download the latest version via our software page.
Although you may not always require the new functionality, or may not wish to spend the time necessary during configuration, we still recommend upgrading, as you can be sure you are always working with the most up-to-date product.
If you're using multiple units, it's possible to upgrade them at the same time, as long as they have the same model number.
You can use Google’s SMTP server to send automated e-mail through your Gmail account. This requires special settings, which are slightly different than typically found with other email clients.
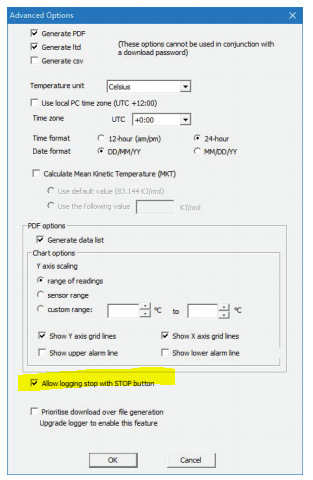
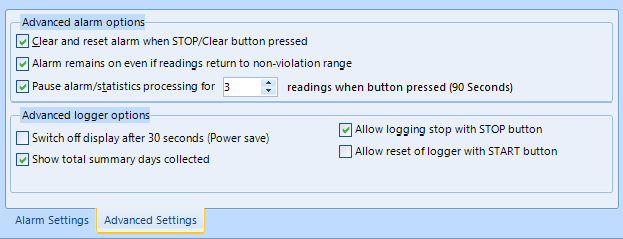
If necessary, the "STOP" button can be disabled during configuration. This prevents someone pressing the "STOP' button while on a trip.
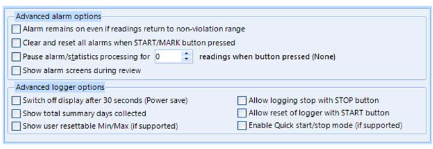
During configuration, click on advanced options for additional configuration settings. These settings decide which files -if any- are generated at the trip and also determine the appearance and contents of generated files.
DEW POINT CALCULATION AND DISPLAY
From LogTag Analyzer version 3.1.9 it is possible to enable dew point calculation and display for LogTag humidity loggers (UHADO-16, HAXO-8, HASO-8). When enabled the dew point is calculated using the temperature and humidity for each logged reading, and displayed on the report, chart and data list.
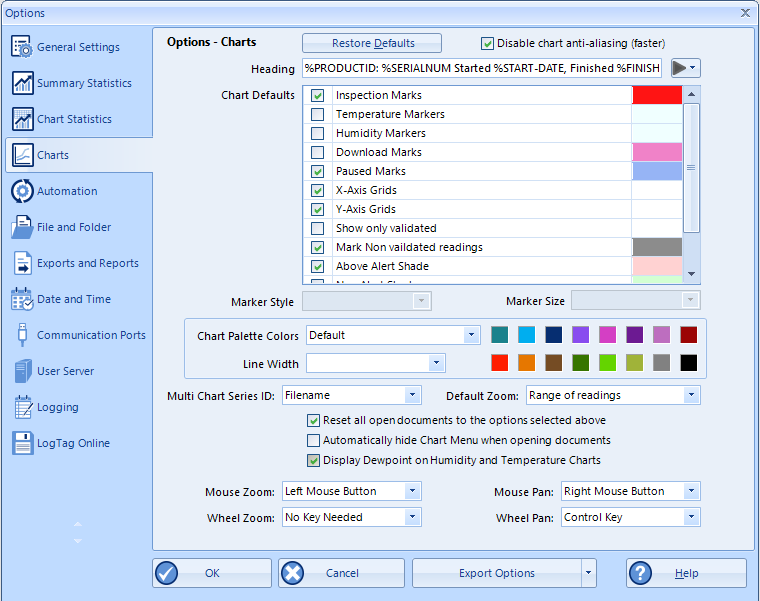
ENABLING DEW POINT IN LOGTAG ANALYZER
DEW POINT DISPLAY
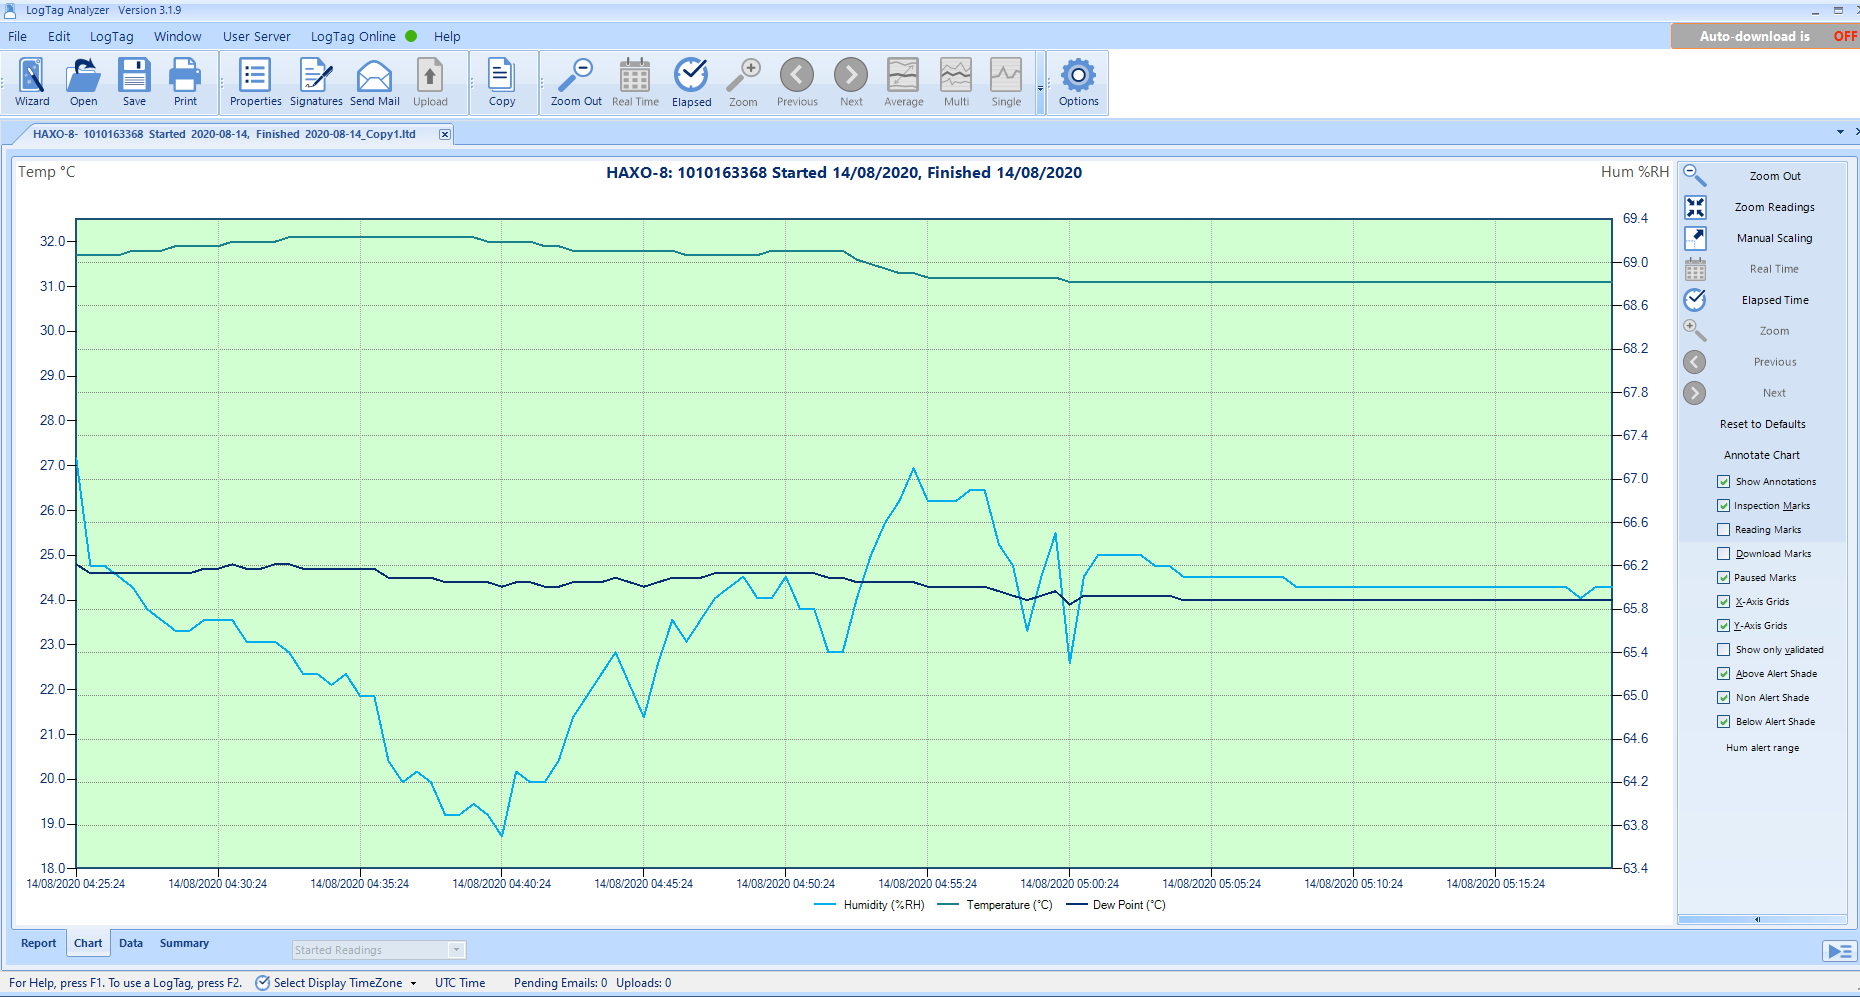
LogTag Analyzer showing Dew point temperature series on the Chart.
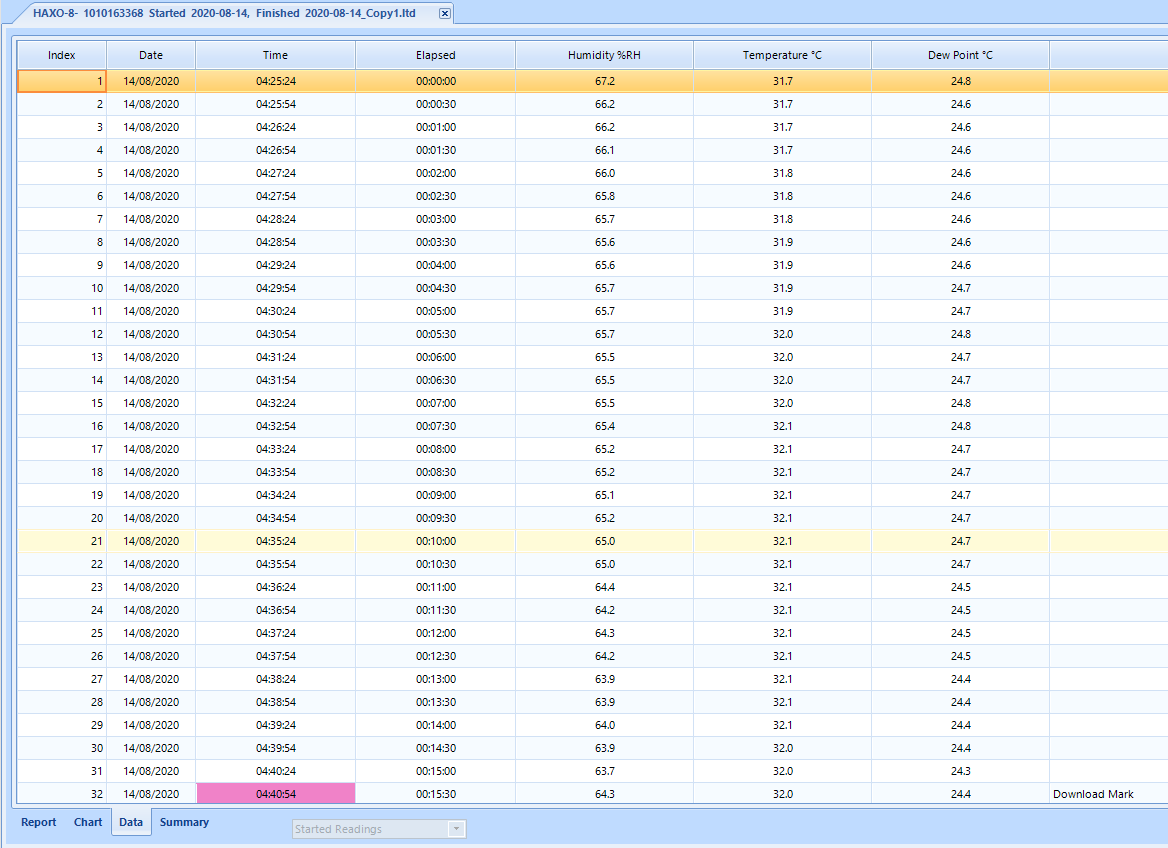
LogTag Analyzer showing Dew point temperature series on the Data list.
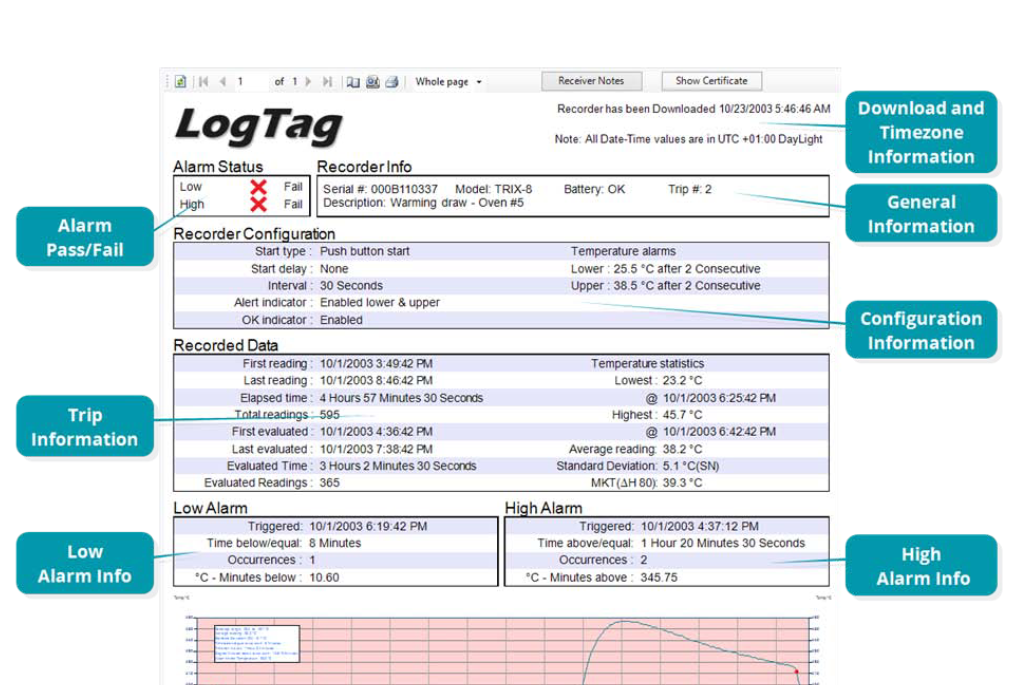
"Evaluated readings" as shown in the Trip information of the LogTag Analyzer Report, are temperature or humidity readings that are used in the statistics calculations. They are data points that are used to calculate the Min, Max or Average readings.
In some cases, if the chart has been zoomed in and a subset of data was inspected, the report will also only show those readings. The zoomed reading time range will also be labelled "Evaluated readings".
Total readings are the total number of sample intervals, or readings taken by the logger. In the case of Humidity loggers, a reading is a Temperature and Humidity value pair where this counts as one reading or one sample.
If the "Pause alarm/statistics process' option is enabled in a data logger, pressing either button on the LogTag® while recording excludes the next reading from the alarm and statistics calculations and PAUSED will be shown on the display. Readings that are recorded while the logger is PAUSED do not count as evaluated readings, but still count towards the Total Readings displayed in the logger reports.
For USB loggers, they are unable to take accurate temperature or humidity readings whilst connected to USB power. Loggers that are still recording in this state will not record a reading, but mark it as USB PAUSED in the readings log. These readings will not count as "Evaluated readings" but will count towards "Total readings" in the report.
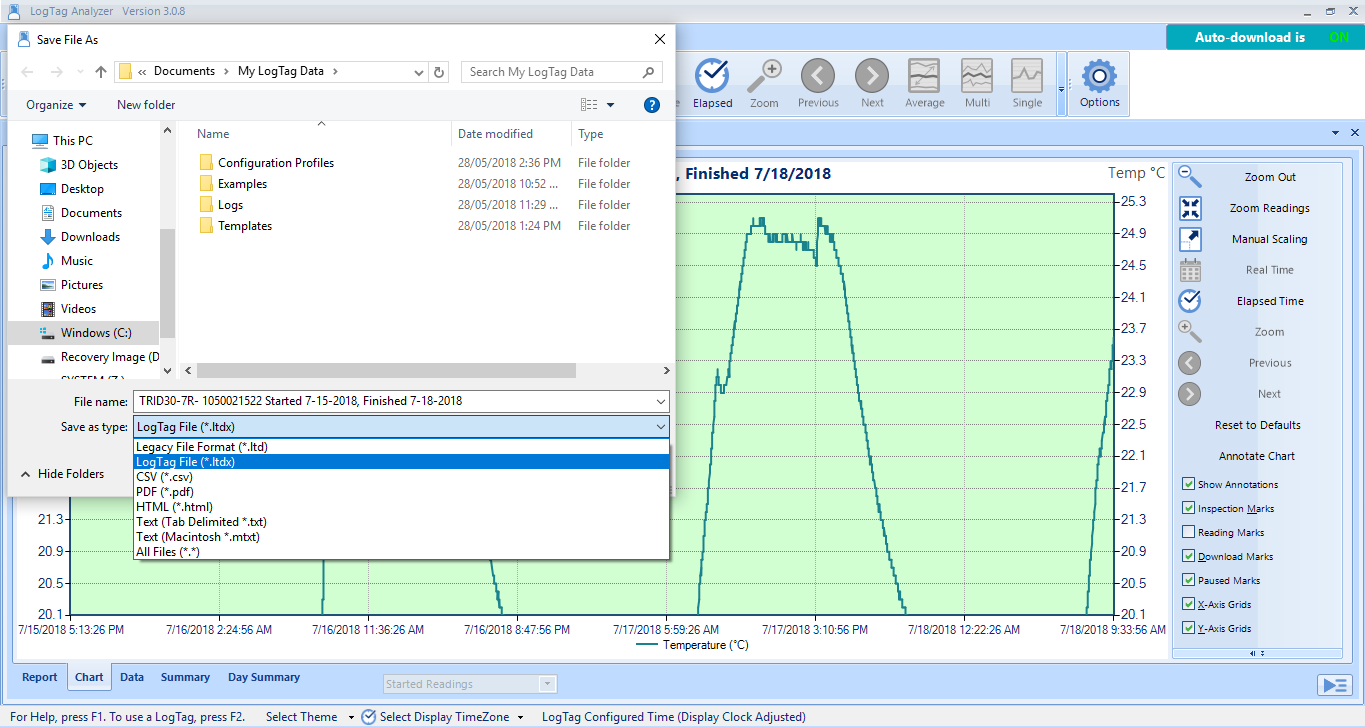
Downloaded data are stored in a LogTag Data file (*.ltdx), which is a proprietary secure format that is tamper-proof. This is a requirement in many applications and standards (such as the FDA 21 CFR Part 11 in the US).
*.ltdx files can only be accessed and viewed by LogTag Analyzer software, so if another person wishes to view the data on different computer then either they need to install LogTag Analyzer (which is free for download and use) or the data needs to be exported to another format.
LogTag Analyzer stores data in a folder which can be set in the Options, where you can also choose to automatically store data upon downloaded. LogTag Analyzer can export data either manually or automatically to formats capable of being imported by other applications such as MS Excel, however, data exported this way are no longer secure/tamper proof.
If you download your readings and notice a big difference in measurements, it's highly likely that the battery is getting to the end of it's life and has caused a corruption within the Logger.
The impact of often downloading the data is quite significant on battery life and can be reduced by turning off (hibernating) the Logger between uses.
You can check the average battery life of your Logger on our products page, by selecting your model number. On average this is between 2-3 years.
If your Logger is relatively new and you still have the same problem, please send us a diagnostics file.
-40 DEGREES CELSIUS READINGS
If your Logger only records temperatures of -40 degrees Celsius this could be a connection problem with the probe.
All of our data loggers automatically insert error detection codes into the log memory while they record. When these detection codes for a block of recordings fail the integrity validation, the relevant readings are marked as non validated readings. On your data list, non validated readings are displayed differently to validated readings by default, to indicate that they have failed this integrity test. For the chart, this option can be enabled in the option settings. These error detection codes are saved with the file so any attempts to manipulate data in a saved file are also detected.
There are several reasons why data can be marked as non validated:
Only in very rare cases is this a result of a memory fault in the logger itself.
It is not possible to only download the usable data, however you can do the following:
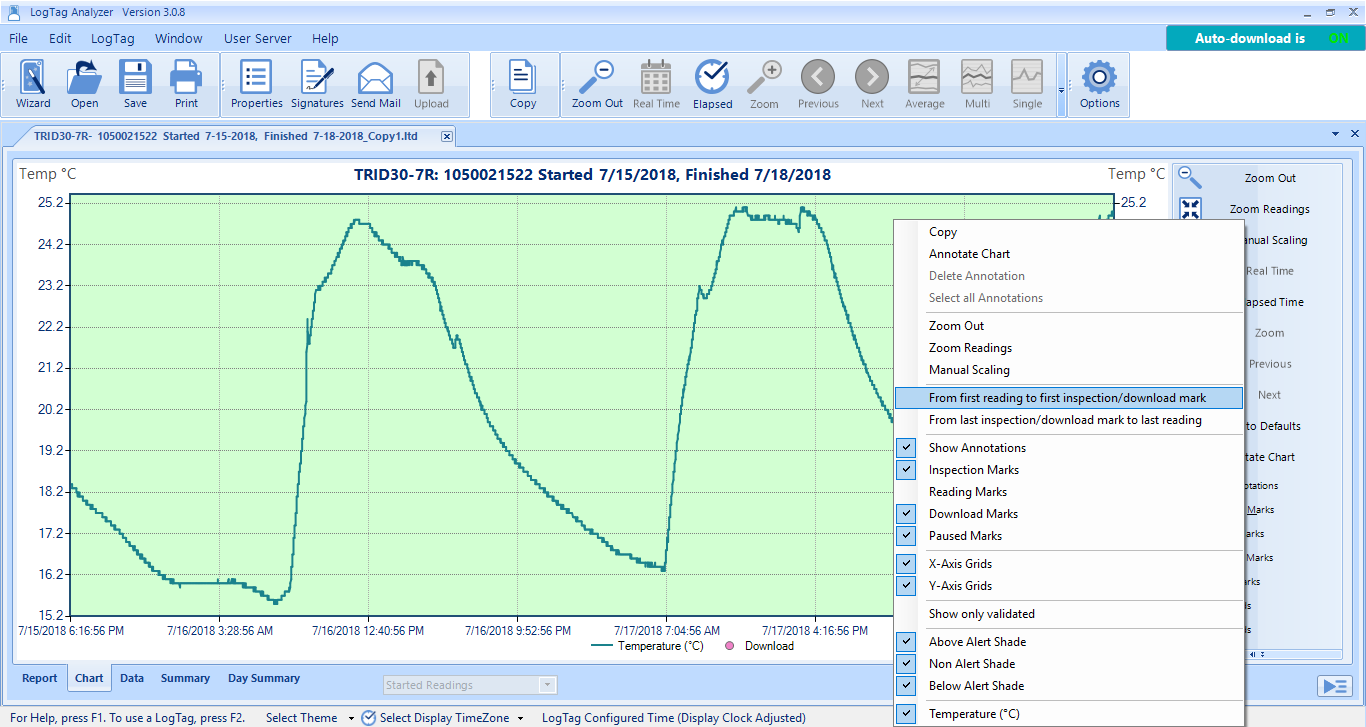
Or if you want a specific set of data, you can left-click and drag to select the specific data you are interested in.
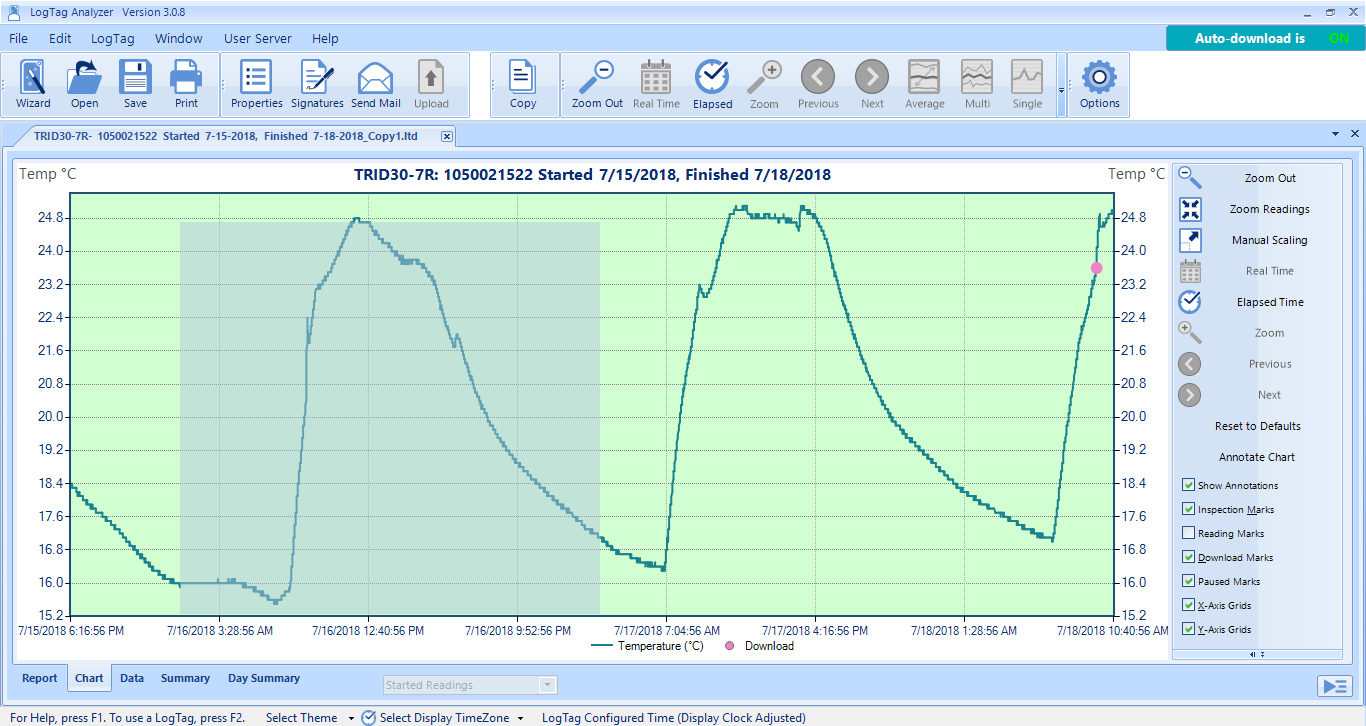
In all of these above cases, the Report, Data and Summary are updated to reflect only the data selected.
You can Copy/Paste the chart or data etc….as described above, or you can click File-Save As and select "LogTag File (*.ltdx)" – to save the data you selected.

In order for you to export data to excel, go to the Data tab, then click Edit-Copy.
Then open Excel and Paste.
Similarly, if you are on the Summary tab, if you click Edit -> Copy – you can then paste the summary information into Excel.
If you are on the Report or Chart tabs, If you click Edit-Copy, you can then paste the report or chart into Excel, Word or PowerPoint etc.
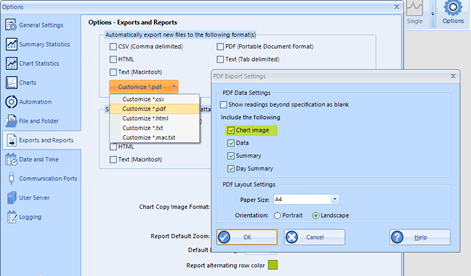
When you save a PDF you can choose to include information from any of the displayed tabs, this is set in the Menu Edit -> Options -> Export and Reports -> Customize PDF, which allows you to include the information from extra tabs, such as the data tab and summary tab into the exported PDF.
When printing, you are printing what you see on the screen, since the tabs are displayed separately (you can only see the content of one tab at a time,) you would have to print each tab order to get physical copies of the data.
All data in LogTag Analyzer is displayed from a downloaded file, not directly from a Logger. The data is automatically downloaded to the following folder: C:\Users\User\Documents\My LogTag Data, unless the folder location has been changed by the user to their preferred folder location.
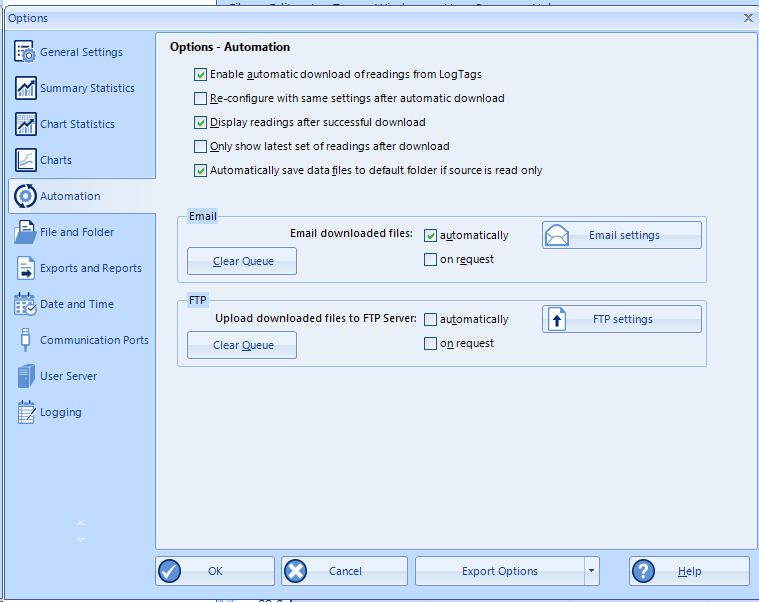
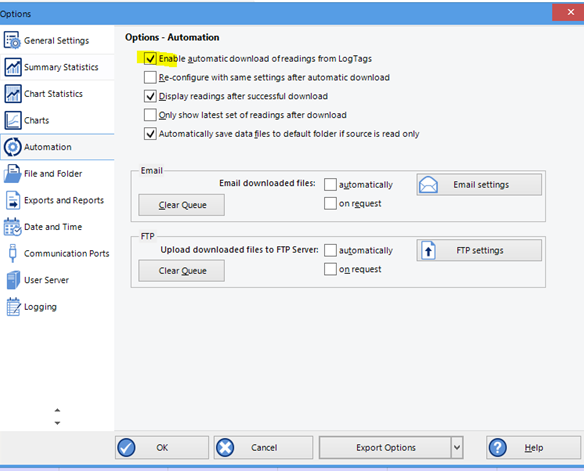
Has the Logger been reconfigured and used to record temperatures again since the period you're missing data from? If yes, then the old file is likely to have been overwritten and is not recoverable. To avoid losing your data if you accidentally reconfigure before downloading - please check your automation settings. Click Edit-Options-Automation. Check that the option highlighted in yellow below is selected - so data will download automatically when you cradle the Logger.
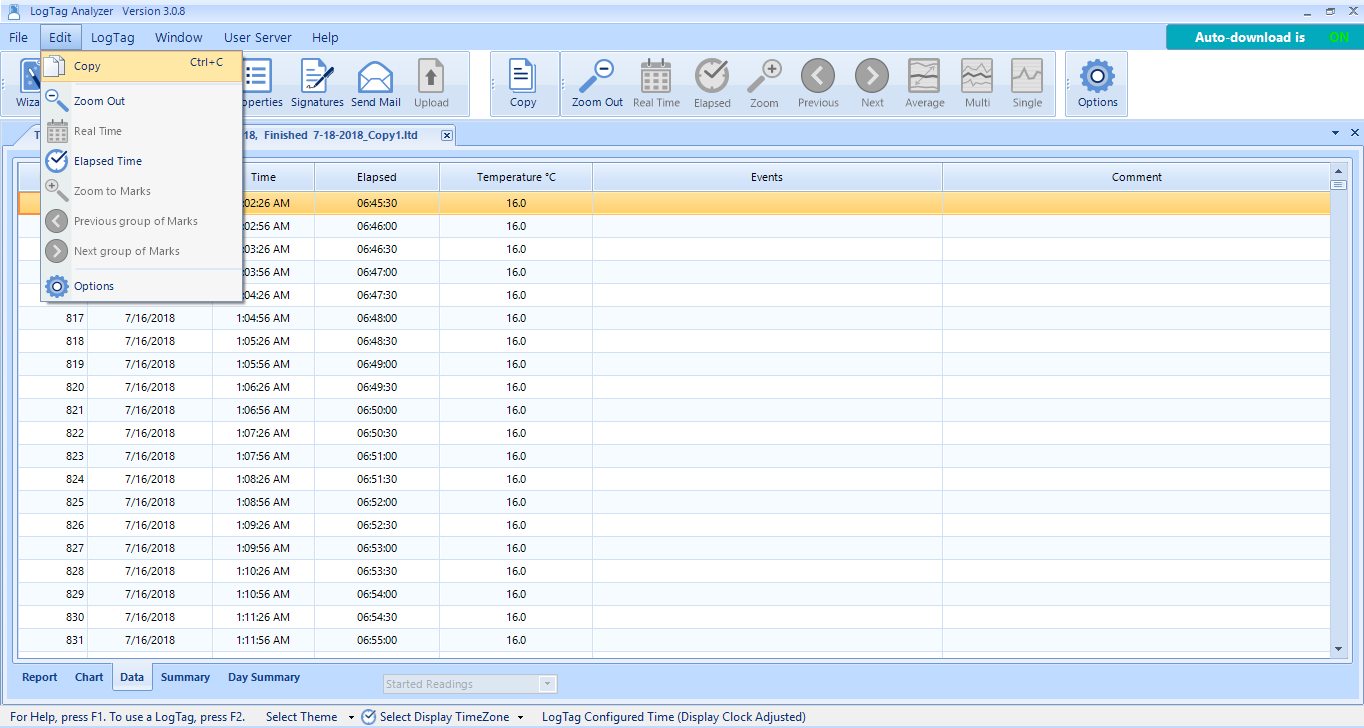
To save data for just a specific period into a report eg for a monthly or weekly report:
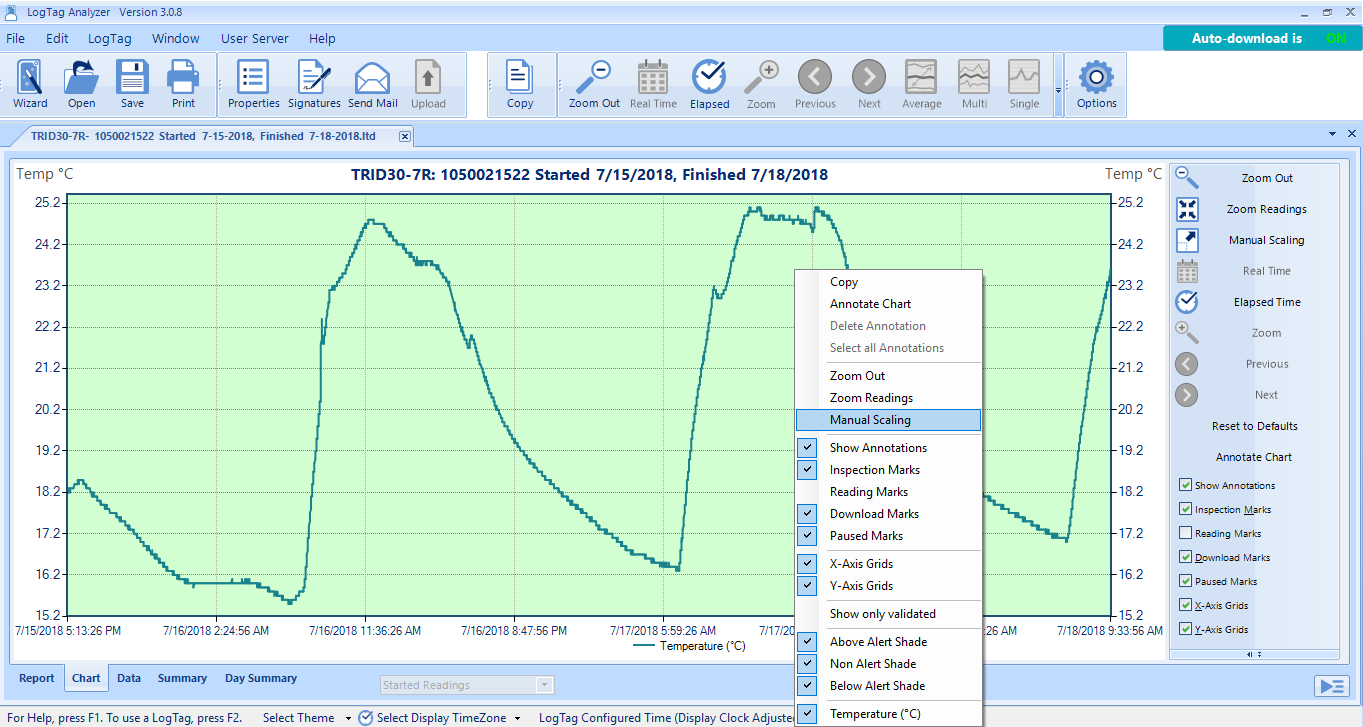
Right-click on the chart and click on Manual Scaling.
Select Manual and enter in the dates and times between which you want to report on e.g. 01/11/2017 12:00 to 30/11/2017 11:59, and click OK.
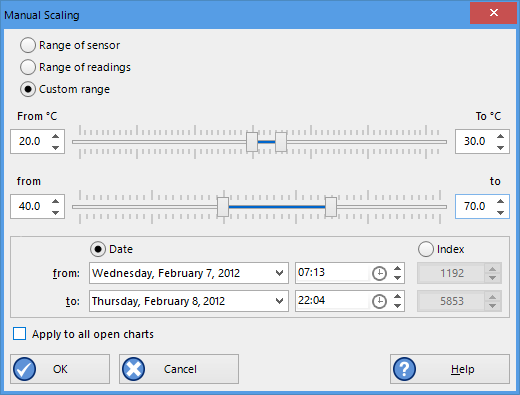
Then click on File-Save As and select "LogTag File" (*.ltdx). This will update the Report, Data and Summary tabs to only show information for the specified period.
If you are having problems downloading data from your Logger, it could be related to the following:
If you want us to do further research, please send us a diagonistics file.
When Loggers are showing extreme temperature differences (-40°C or -199.9°C), these out of range readings are usually caused by;
In LogTag Analyzer, when configuring the Logger, click on 'Advanced Options' and check the 'Pause alarm/statistics processing for X minutes'. For a 10-minute logging interval, pausing for 2 readings will give you 20 minutes to remove, download and replace the Logger.
Please make sure to press "REVIEW/MARK" when taking it from the monitoring environment to ensure Pause is activated.
LogTag Analyzer printing has been optimized to work with high-resolution monitors. This is a resource intensive task and the application may get stuck or crash on processing files, especially if trying to "Print All" multiple open documents.
If high DPI monitors are not being used, support for them can be turned off in Analyzer. This will allow to free resources and print multiple files faster:
Note: The configuration file will need to be replaced again after updating LogTag Analyzer to a newer version.
Currently, when a UTRED30-WiFi, UTRED30-16, UTREL30-WiFi or UTREL30-16 unit triggers an alarm, both the buzzer and LED operate, but only until the measured temperature returns to the acceptable band. The expected behaviour is that the LED and buzzer both continue until the Alarm is cleared.
Both the cross and day markers on the LCD and the alarm processing via LogTag Online are not impacted and work as expected.
There is no current work-around for this issue.
We will issue a firmware update to resolve this problem as soon as it becomes available.
en/faq/logtag-analyzer/led-buzzer-behaviour-utred30-utrel30/
On rare occasions, you may receive a message during configuration that a logger has a damaged calibration.
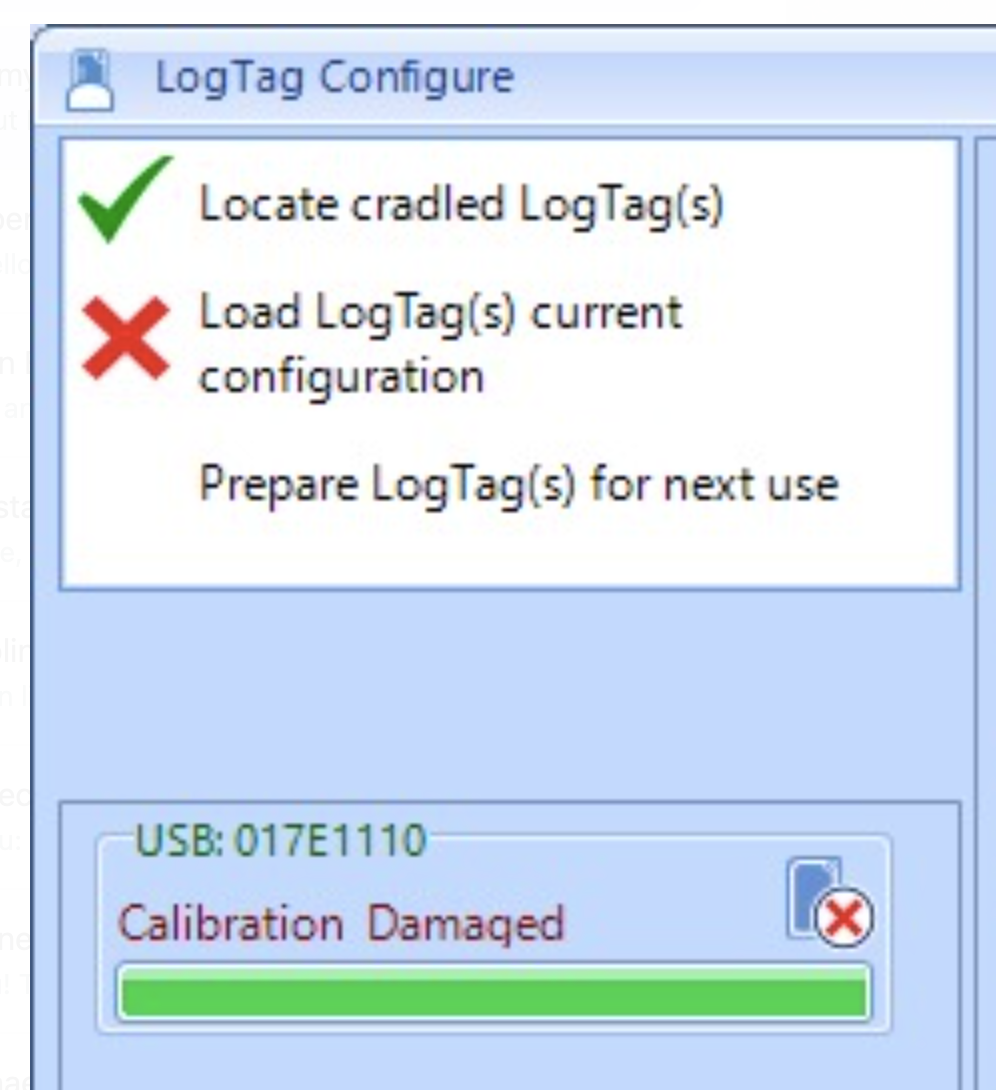
We are aware of an issue that affects a small number of TRED30-16R, TREL30-16 and TRID30-7 loggers when used with an LTI-HID interface.
If you encounter this issue, please contact us via email to info@cik-solutions.com
Close LogTag Analyzer. Download the tool, extract, and start it.
Cradle the LogTag logger with the damaged calibration and click on the "Start repair" button. Once the repair is completed, the text "LogTag repaired" will be displayed.
If you encounter any issues during the repair, please email software@logtagrecorders.com for further support.
en/faq/logtag-analyzer/damaged-calibration-after-configuration/
In the very unlikely scenario that a UTRED30-WiFi records only pre-start readings, and these readings wrap, the resulting file shows a small gap at the time the buffer has wrapped. No readings are lost. This will be corrected in the next release.
LogTag customers using LogTag Analyzer 2.6 (and possibly earlier versions) are reporting error messages when attempting to download loggers.
The current versions of LogTag Analyzer, 3.1.2 and 2.9 r8, have been tested and do not have the issues seen with LogTag Analyzer 2.6.
We are recommending customers currently using any version of LogTag Analyzer 2.6 update to 3.1.2 or 2.9 r8 and then try downloading the logger again.
The latest versions of our LogTag Analyzer software are available for download from our Software page.
Errors may occur when trying to configure or download USB loggers (UTRIX / UTRID / USRIC) with LogTag Analyzer 3.1.0.
This is what the error looks like when you're configuring your Logger:
and this happens when you are trying to download data or try to open LTD files (data files):
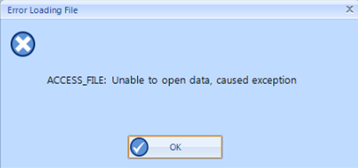
Please update your software to the latest version. This will resolve the issue.
There is a known issue with opening LogTag Analyzer 3 data files. When you double click the data files, it's possible you will get an installer pop-up instead of LogTag Analyzer 3 actually opening the data files.
Please update your software to the latest version of LogTag Analyzer 3. This will resolve the issue.
Have you received an error message? Make sure you always use the latest version of LogTag Analyzer. This will solve in most cases the errors you have, including the "$1 internal error". This error occurs when the software is trying to communicate with a model that is newer than your current version of LogTag Analyzer supports.
Update your software via LogTag Analyzer by going to "Help" and "Check internet for updates". Or visit our website to download the latest software version. If you’re currently running an older version, the software will automatically update your version.
An error message can also be the cause of a low battery. Check your battery life to be sure.
ERRORS “CANNOT CONNECT TO LOGTAG…” OR “$4:USB.0012345” OR “FAILED TO RESPOND [20]”
Have you received any of these error message; “Cannot connect to Logtag…” or “$4:USB.0012345” or “failed to respond [20]” or simply error [20]?
These are very general error messages which simply mean that LogTag Analyzer found an interface and detected the presence of a Logger inside the interface but was unable to establish communication. The letters and numbers after $4 represent type and serial number of the interface.
Often this error will disappear by simply repeating the action you were performing when the error occurred, but sometimes it can be a bit more difficult to locate the cause. Here are some scenarios in which these errors could occur and what to do to rectify the issue:
If the progress bar stalls, LogTag Analyzer may be trying to communicate with a Bluetooth COM port that has no interface attached. Please disable all unused COM ports. If you exclusively use USB interfaces, you can select “Disable all serial interfaces" from the Edit – Options – Communication Ports dialogue.
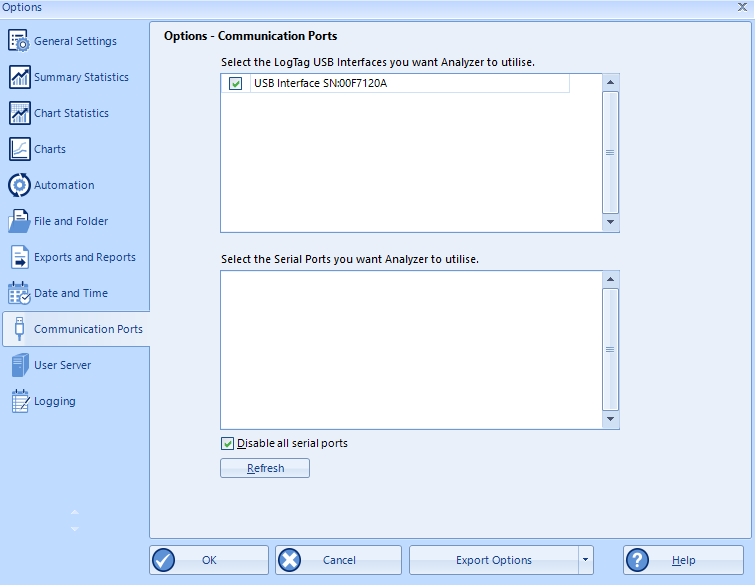
This will speed up communication, as LogTag Analyzer will not need to check for connected serial Interface Cradles.
Each time you configure or download a Logger via the menu, all available communication ports are checked for Interface Cradles with Loggers. LogTag Analyzer restricts this search to ports that can physically have an Interface Cradle attached, and are also enabled in the communication options.
If you cannot see any interfaces in the access screen, and the progress bar stalls at 0% you should check the following:
en/faq/logtag-analyzer/interface-cradle-not_showing-in-access-window/
This error means that LogTag Analyzer can't find an attached interface or Logger. In the following example:
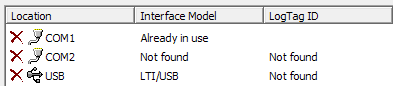
en/faq/logtag-analyzer/receiving-the-notification-com1-com2-com3-com4-not-found-already-in-use/
If you receive the following error message "Not all settings are supported" when configuring, please update your software. This should solve this error message.
If you’re currently running LogTag Analyzer 2, this software will automatically update your version.
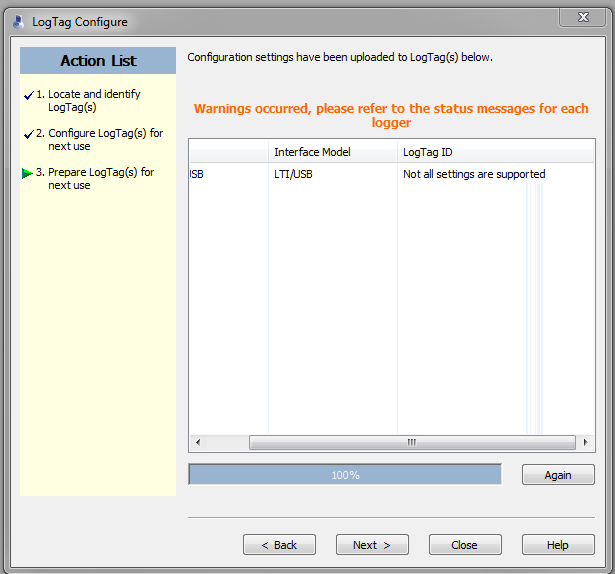
If you still see an error after updating the software, please send us your diagnostics.
If the LogTag Analyzer freezes during the download of your data, it's highly likely that the battery is getting to the end of it's life and has caused a corruption within the Logger. The impact of often downloading the data is quite significant on battery life and can be reduced by turning off (hibernating) the Logger between uses.
You can check the average battery life of your Logger on our products page, by selecting your model number. On average this is between 2-3 years.
If your Logger is relatively new and you still have the same problem, please send us a diagnostics file.
LogTag Analyzer sets the Loggers internal real time clock to the configuration PC’s time.
When your PDF report or display doesn't show the right time compared with the time of your PC, you may not have set the correct Time zone during configuration.
To show the correct time on the display, re-configure the logger in LogTag Analyzer via the 'LogTag Wizard'. This can be accessed by pressing 'F2' on your keyboard or by clicking the 'Wizard' button.
Press ‘Configure’, click the ‘File Settings’ tab then enable ‘Use local PC time zone’.
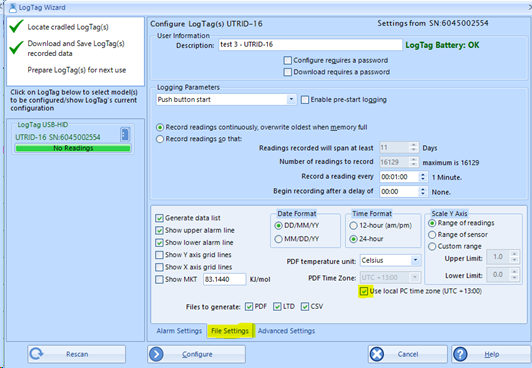
Press ‘Configure’ again, and then click ‘Close’. Disconnect the logger from your computer, the time on the display screen is updated.
DIFFERENT TIME ZONES
With LogTag Analyzer, you can set the PDF time zone to a pre-defined time zone. The time zone for a USB Logger’s PDF time must be set in the advanced dialogue during configuration only and cannot be changed once a PDF report is generated.
LogTag Analyzer has the ability to display the data using a range of different time zones, depending on the settings you make in the 'Display Time Zone' entry in the 'Date and Time' window from the Edit – Options menu.
Please follow the above instructions to show the right time.
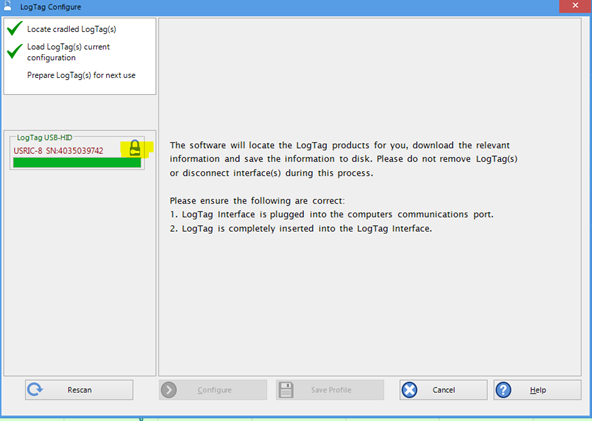
The lock symbol appears if the logger is a single-use logger which has already completed a trip. Single-use loggers, such as SRIC-4, SRIL-8 and USRIC 4/8/16, cannot be reconfigured for another trip. However the data stored on the logger can be downloaded as many times as you need to.
Our products page gives you an overview of all our Loggers.
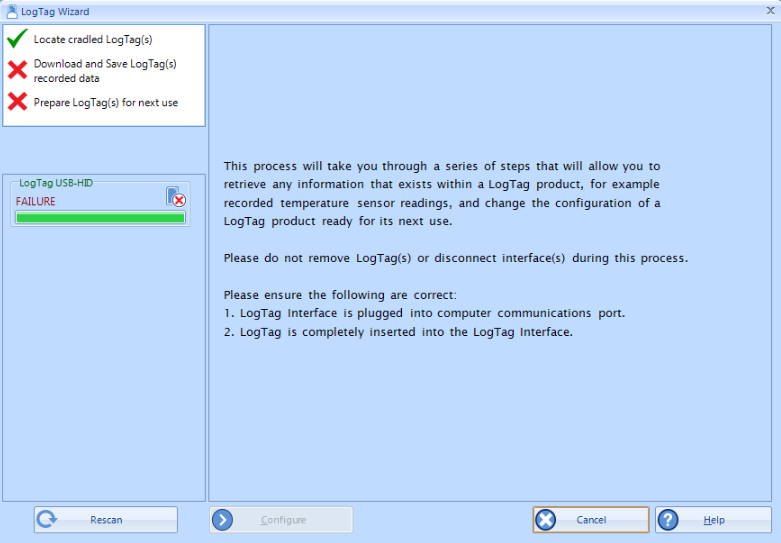
When you have inserted the Logger into the interface cradle, are trying to download (re-configure) the Logger but you see the following error message on the screen;
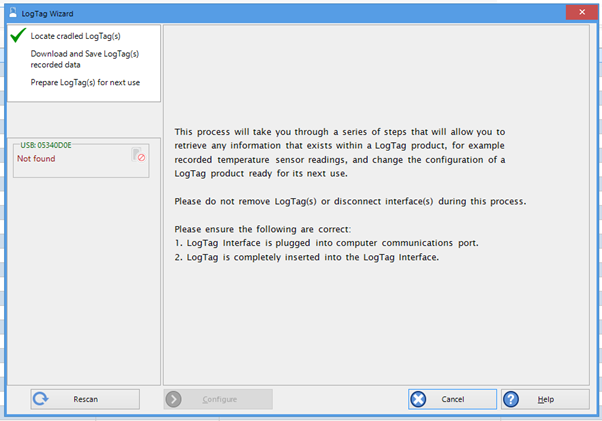
You may also see the message 'Error [23]'.
It means that the Logger interface cradle is working correctly but the communication between the interface cradle and Logger is not working.
Ensure that the Logger is inserted correctly, with the metal contacts on the Logger, mating with the protruding contacts inside the cradle.
If you are still having issues here are some suggestions that might resolve the issue;
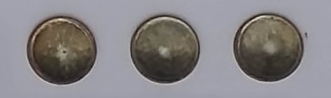
Dirty contacts
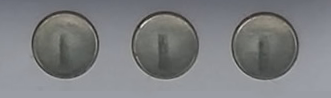
Clean contacts
If you can’t find an answer in our knowledge base and your LogTag Recorder please submit a support ticket with some additional information about your issue.
Please send us a diagnostics file;
An email will open with attached files, including a partial memory download of the Logger.
In the message field, enter any additional information about the problem you are experiencing (for example: screenshots of error messages), which model you are using and the serial number of your Logger .
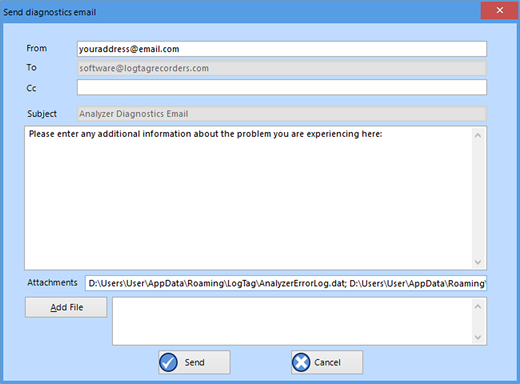
If you work on a PC not connected to the internet you can still send us the files. Open Windows File Explorer and navigate to the folder you see listed in "Attachments" (this is your "Roaming" folder on your PC). Transfer all files listed in "Attachments" to a different PC and use your regular email client to send them to software@logtagrecorders.com.