TRED30-16R
The Logger will display up to 30 days of max/min/duration and alarm statistics. If the Logger is configured to record longer than 30 days (or continuously) then the day statistics will contain up to the latest 30 days.
To review the day statistics, press the ‘review button’. Each press of the button will step through the Max and Min temperatures for each day starting with today and moving backwards through the days (displayed day will flash). Any button activity during recording will place an inspection mark in the next reading of logged data which will be displayed when the data is downloaded.
Following are some examples:
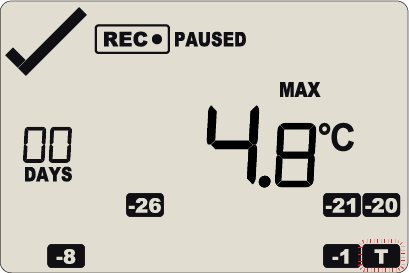
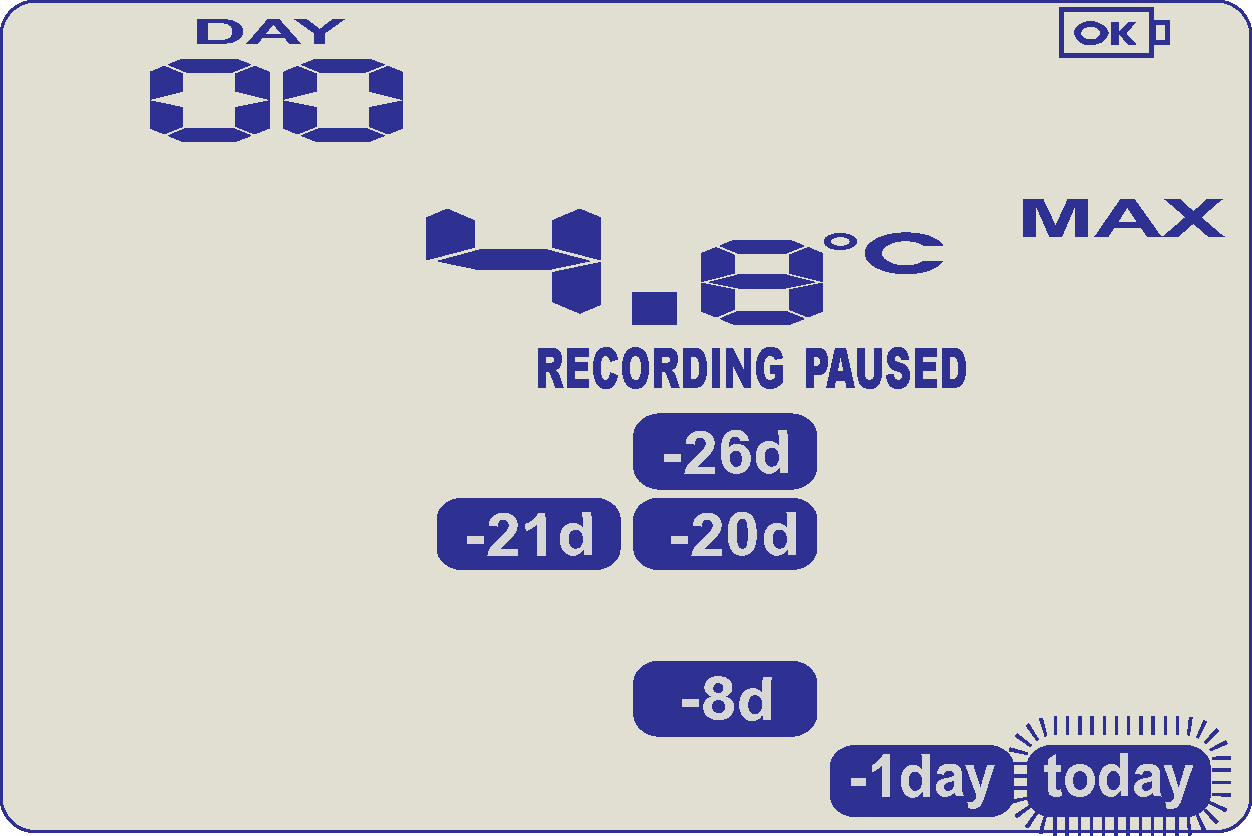
Pressing the 'review button' displays current days ‘MAX’ statistic. The ‘TODAY’ segment flashes and ‘DAY 00’ is shown to indicate the ‘Today’ selection.The selected day (today) does not have any recordings outside the preset limits.
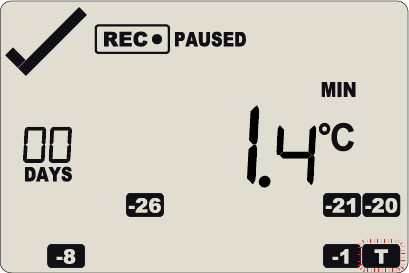
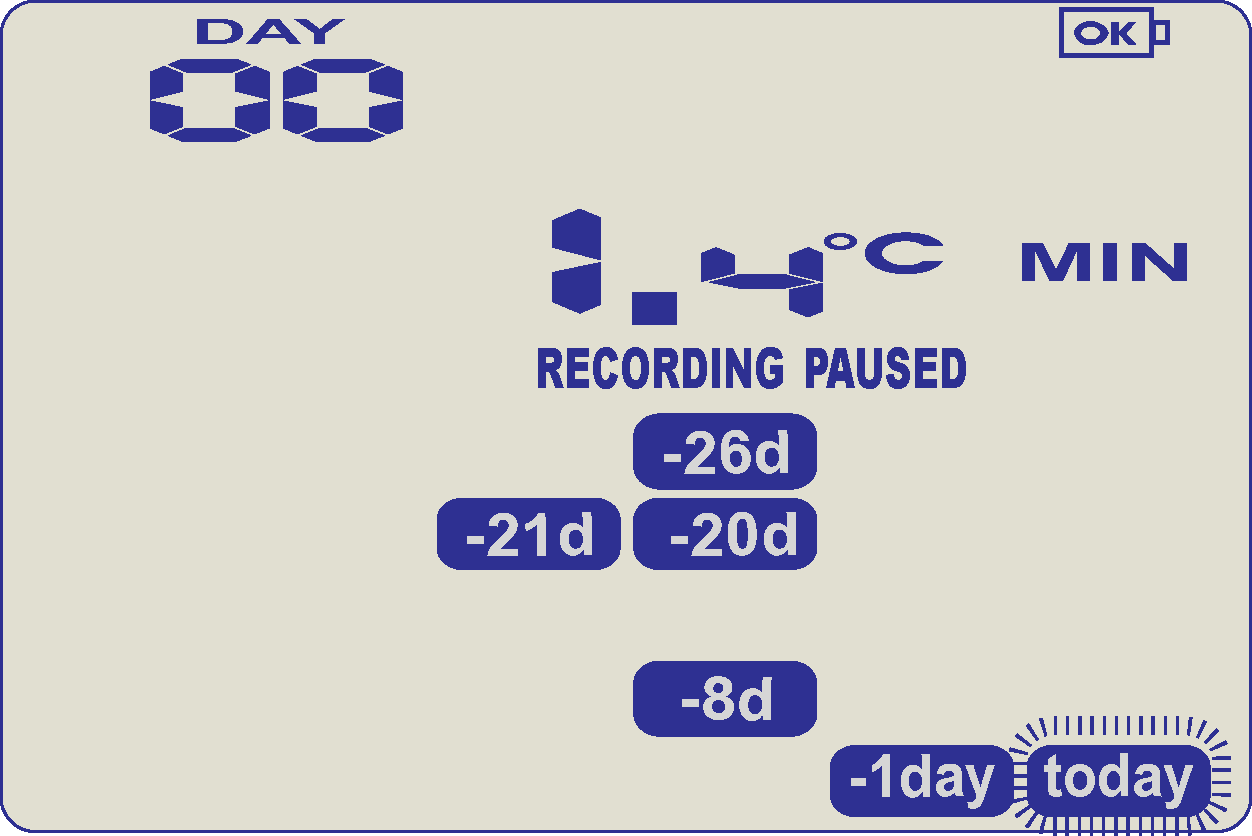
Pressing the ‘review button’ again displays the days ‘MIN’ statistic. The ‘MIN’ statistic is not below the limit and did not trigger an alarm.
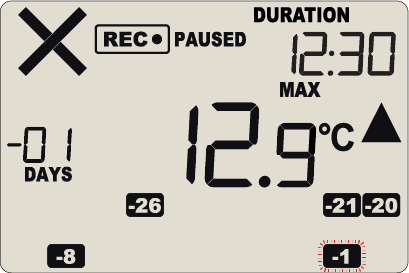
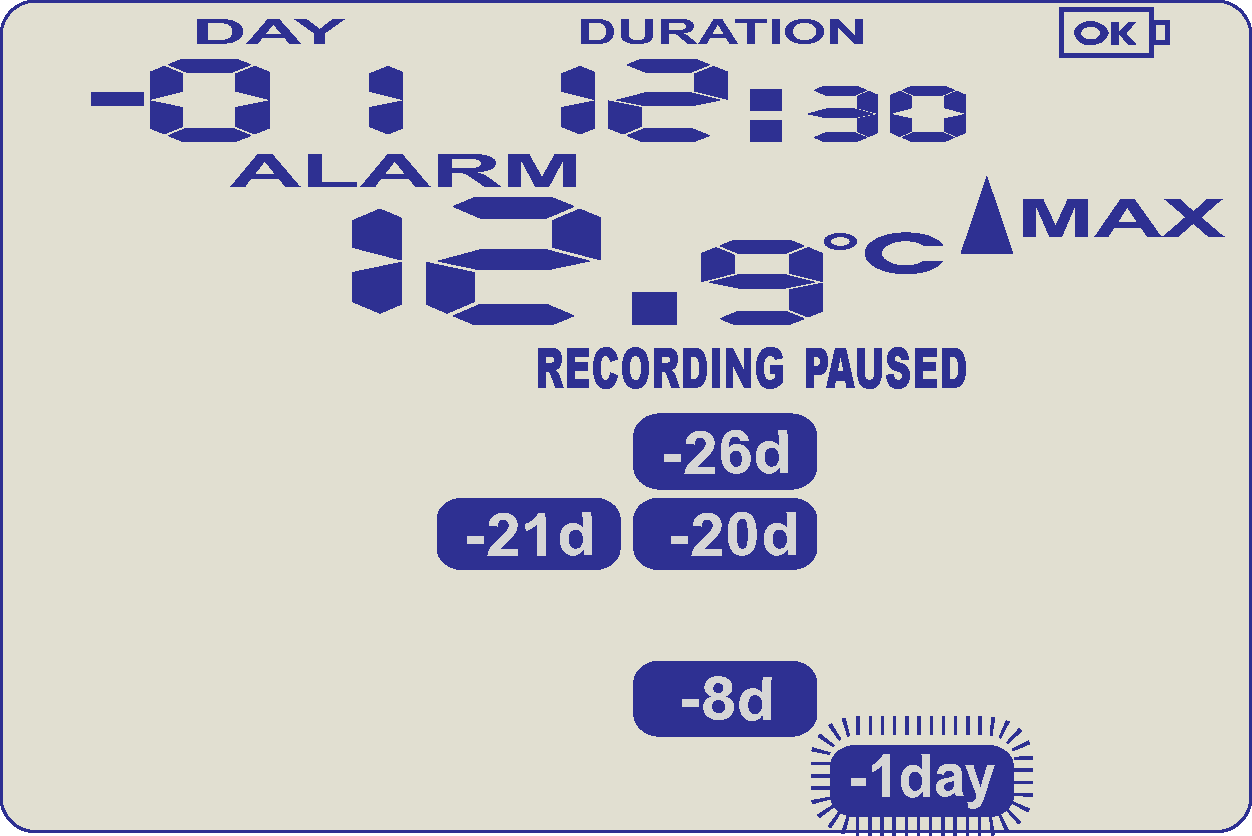
Pressing the ‘review button’ again displays the next previous days ‘MAX’ statistic. There are recordings that are above the upper limit. The ‘MAX’ statistic is above the upper limit (indicated by the arrow pointing up) and the ‘ALARM’ was triggered for a duration of 12 hours and 30 minutes.
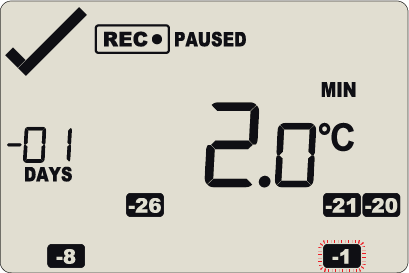
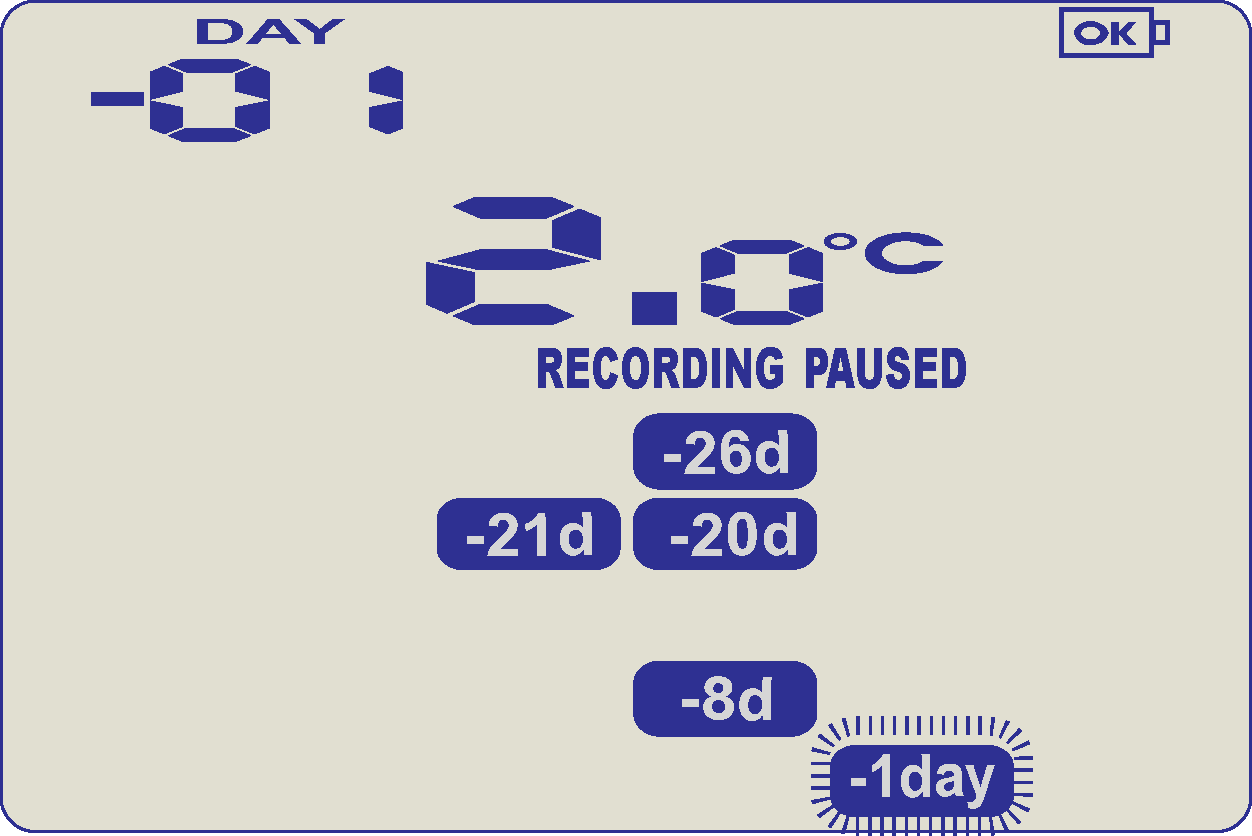
Pressing the ‘review button’ again displays the days 'MIN’ statistic. The ‘MIN’ statistic is not below the limit and did not trigger an alarm.
TRID30-7
The Logger will display up to 30 days of max/min/duration and alarm statistics. If the Logger is configured to record longer than 30 days (or continuously) then the day statistics will contain up to the latest 30 days.
To review the day statistics, press the ‘review button’. Each press of the button will step through the Max and Min temperatures for each day starting with today and moving backwards through the days (displayed day will flash). Any button activity during recording will place an inspection mark in the next reading of logged data which will be displayed when the data is downloaded.
Following are some examples:
Pressing the ‘review button’ displays current days ‘MAX’ statistic. The ‘TODAY’ segment flashes and ‘DAY 00’ is shown to indicate the ‘Today’ selection. The selected day (today) does not have any recordings outside the preset limits.
Pressing the ‘review button’ again displays the days ‘MIN’ statistic. The ‘MIN’ statistic is not below the limit and did not trigger an alarm.
Pressing the ‘review button’ again displays the next previous days ‘MAX’ statistic. The ‘MAX’ in this example is above the upper limit (indicated by the arrow pointing up) and the ‘ALARM’ was triggered for a duration of 12 hours and 30 minutes.
Pressing the ‘review button’ again displays the days ‘MIN’ statistic. The ‘MIN’ statistic is not below the limit and did not trigger an alarm.
If less than 30 days of recordings have been collected, the day marker only advances as far as there is data available. After the last day for which statistics have been collected is displayed, the next press of the ‘start button’ rolls the summary back to the statistic for ‘TODAY’.